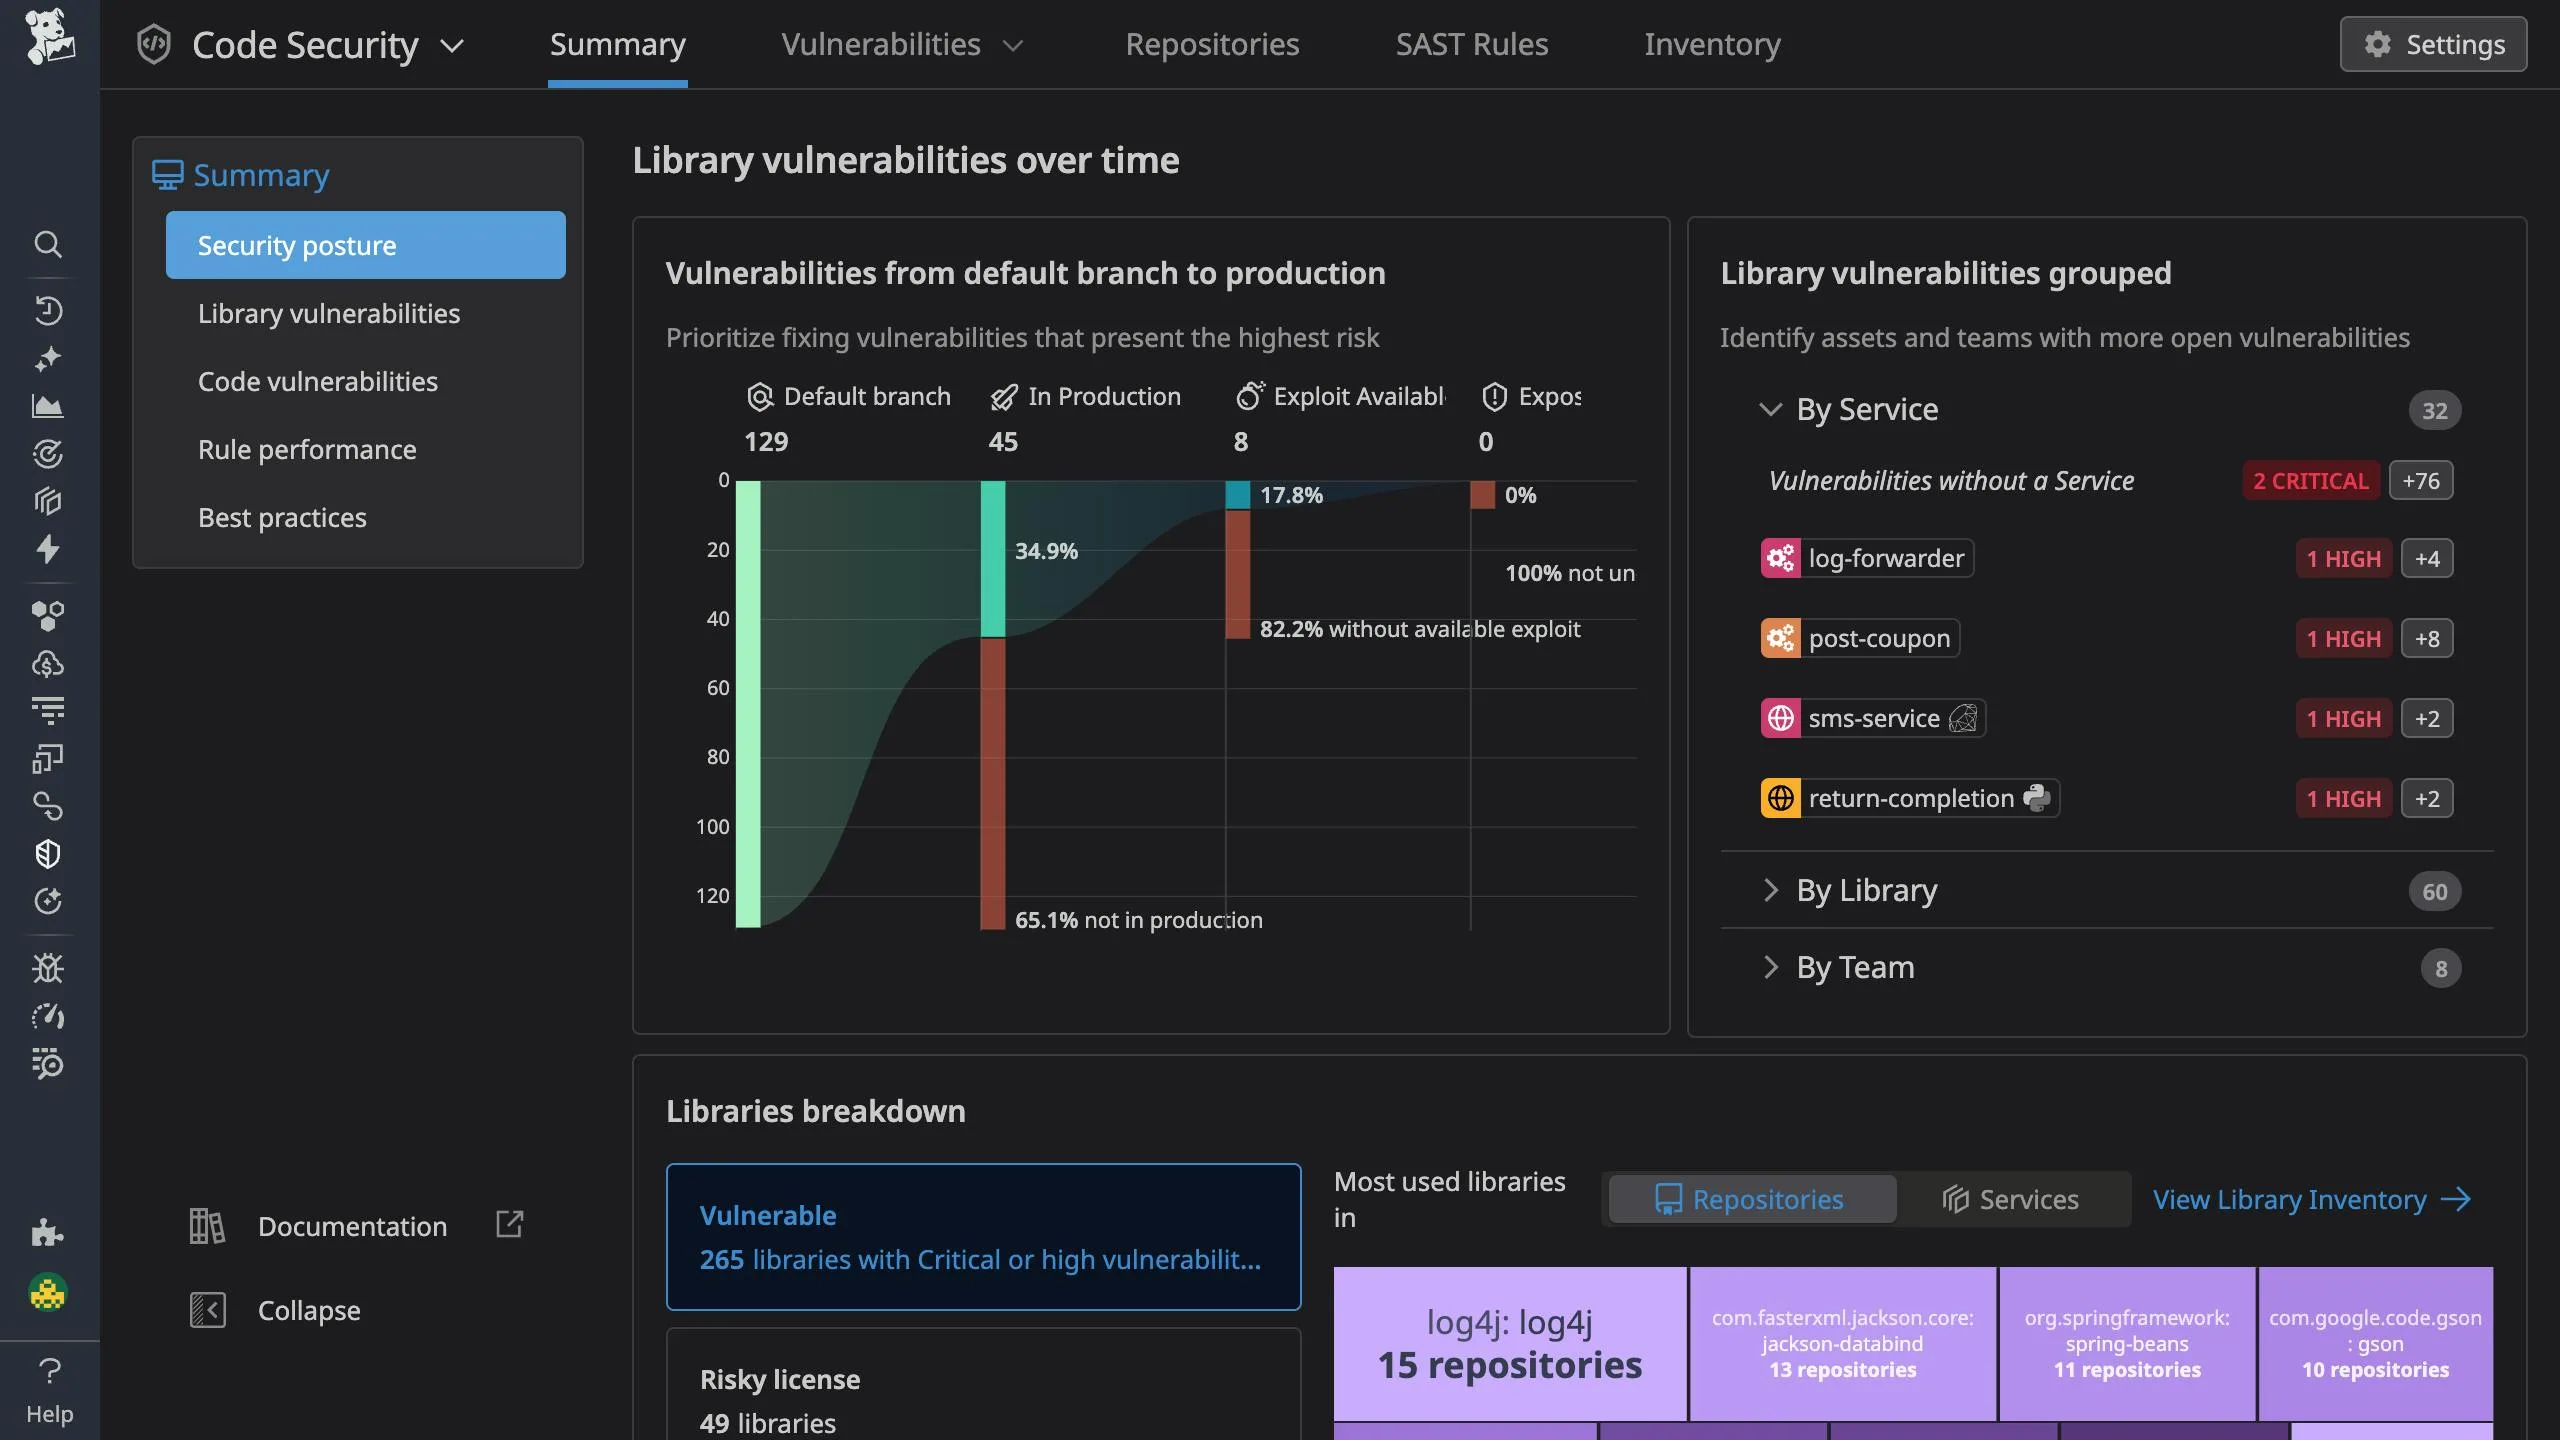
Datadog Code Security provides runtime code analysis (IAST) that detects vulnerabilities in running applications using the same tracing libraries that power Datadog APM. It supports Java, .NET, Python, and Node.js.
The tool achieves 100% on the OWASP Benchmark with over twenty additional detection rules. Because it reuses your existing Datadog tracing setup, enabling IAST is a configuration flag away — no new agent to deploy.
Datadog IAST is part of the broader Code Security suite alongside Static Code Analysis (SAST), Software Composition Analysis (SCA), Infrastructure as Code security, and Secret Scanning.
What is Datadog Code Security (IAST)?
Datadog’s IAST monitors live applications by tracking how data flows through code at runtime. It instruments applications through the same tracing libraries used for APM.
As requests move through your application, the tracer monitors data sources (user input, external APIs) and sinks (database queries, file operations, system commands).
When untrusted data reaches a sink without proper validation, Datadog flags the vulnerability with the exact code location and data flow.
Key Features
| Feature | Details |
|---|---|
| Supported Languages | Java (tracer 1.15.0+), .NET, Node.js (tracer 4.18.0+ / 5.0.0+), Python (preview) |
| OWASP Benchmark | 100% true positive rate, zero false positives |
| Agent Requirement | Datadog Agent 7.41.1+ |
| Enable Flag | DD_IAST_ENABLED=true |
| Deployment | Docker, Kubernetes, Amazon ECS, AWS Fargate |
| Vulnerability Types | SQL injection, command injection, path traversal, LDAP injection, XSS, insecure deserialization |
| Code Security Suite | IAST + SAST + SCA + IaC + Secret Scanning |
| Source Integration | GitHub (code view, blame, issue creation) |
Runtime Vulnerability Detection
IAST detects vulnerabilities that need runtime context to identify. For each finding, Datadog provides the specific file name, method name, and line number where the vulnerability exists, plus the complete data flow from source to sink.
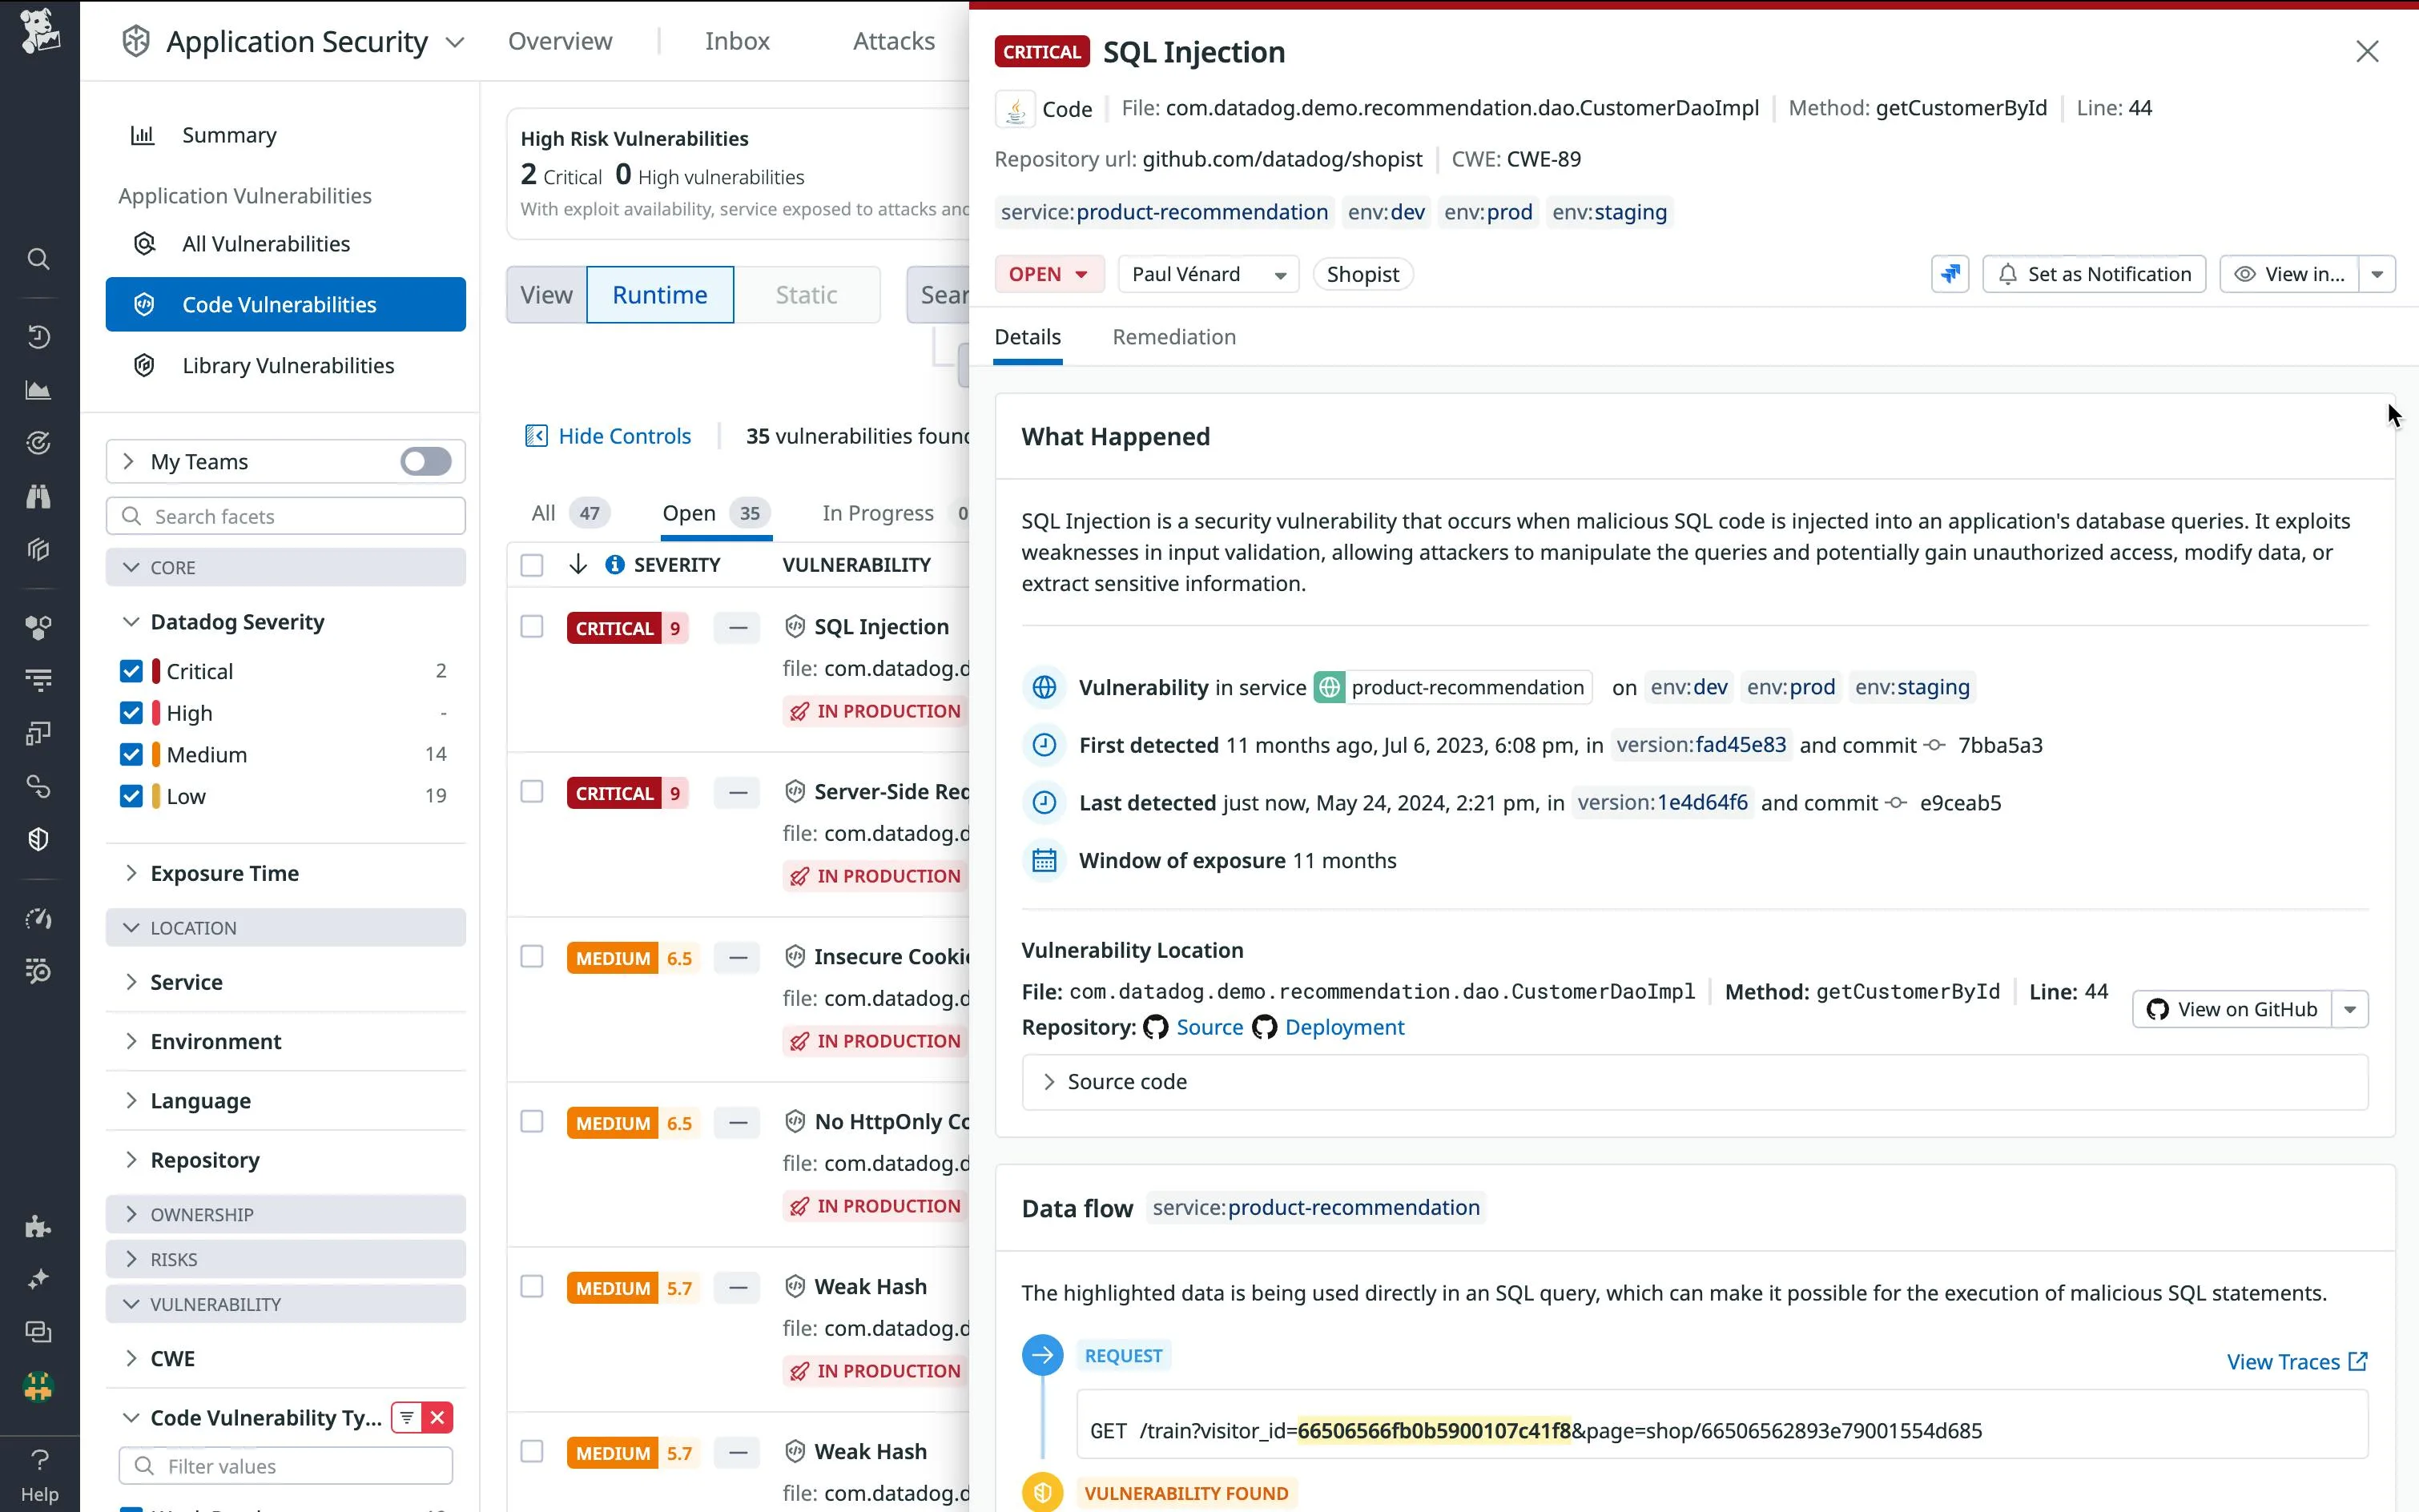
Detected vulnerability types include:
- SQL Injection — tracks user input through string concatenation to database queries
- Command Injection — identifies external input reaching system command execution
- Path Traversal — detects unsanitized input in file system operations
- LDAP Injection — monitors input flowing to directory service queries
- XSS — tracks data from input to output rendering
- Insecure Deserialization — identifies dangerous deserialization of untrusted data
Code-Level Remediation
When a vulnerability is found, Datadog shows the affected file, method, and line number along with remediation guidance specific to your framework. You can view the vulnerable code directly in Datadog if you connect your GitHub repositories.
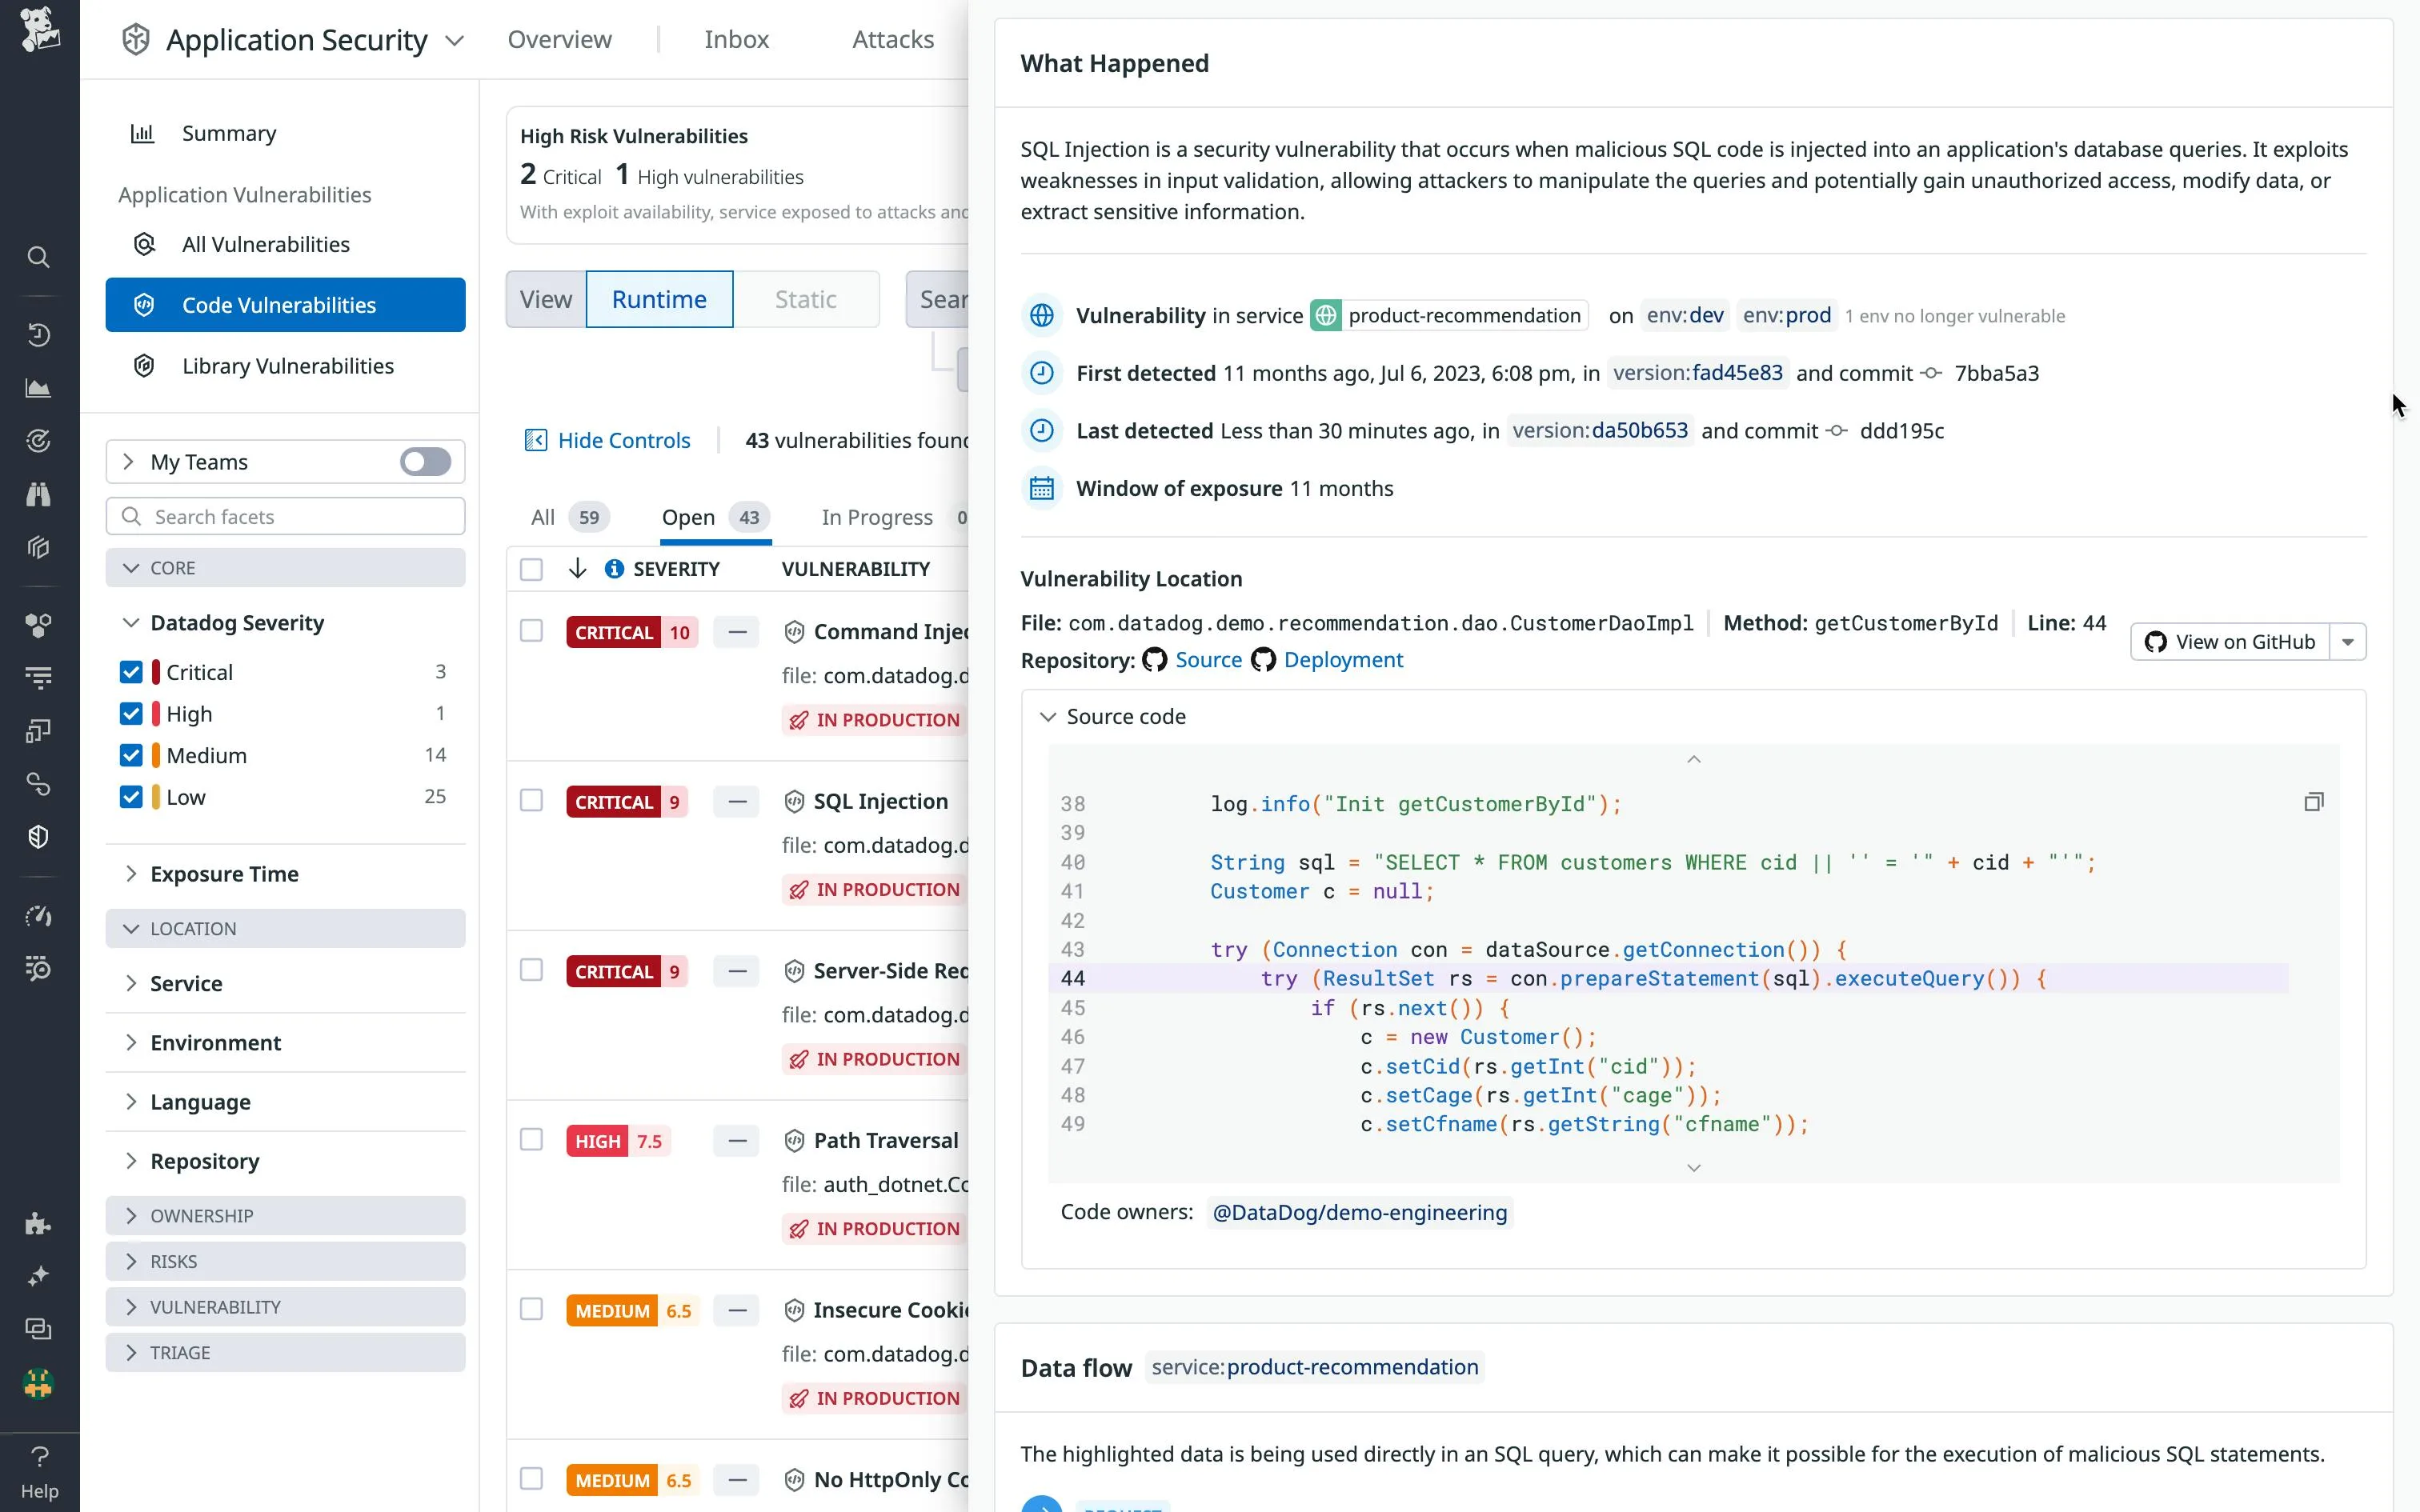
GitHub integration adds:
- Direct links to vulnerable code in your repository
- Git blame information showing who introduced the vulnerability
- The specific commit that introduced the issue
- One-click issue creation in the relevant repository
- Code owner identification
Severity Scoring
Datadog uses its own Severity Score that goes beyond static CVSS ratings. It factors in:
- Whether the vulnerable service is running in production
- Real-time threat activity and exploit availability
- The environment context (dev, staging, production)
- The relationship between vulnerable services, cloud workloads, and infrastructure
Getting Started
DD_IAST_ENABLED=true to your application’s environment variables. If you already use Datadog APM, this is all you need.When to Use Datadog Code Security (IAST)
Datadog IAST is the natural pick if you already run Datadog APM. Enabling it takes one environment variable, and findings show up alongside the performance and reliability data your team already monitors.
The 100% OWASP Benchmark accuracy means findings need investigation, not triage of false positives.
Consider alternatives if your applications use languages Datadog doesn’t support for IAST, or if you prefer standalone security tools not tied to an observability platform. Contrast Assess covers more languages (Java, .NET, Node.js, Python, Go, Ruby). Seeker IAST adds active verification and supports 14+ languages.